
- Sunday Seminole Summary: FSU Football Adds Pair of WR Transfers
- Sunday Seminole Summary: FSU Football Exits ESD With Top-15 Class
- Sunday Seminole Summary: FSU Soccer Tops BYU for Third National Championship
- Sunday Seminole Summary: FSU Soccer Advances to National Championship Match
- Seminole Sunday Summary: FSU Soccer Heads Back to College Cup
- Seminole Sunday Summary: FSU Soccer Reaches Sweet 16; Football Tops Boston College
- Seminole Sunday Summary: FSU Soccer Wins ACC, Advances to Second Round of NCAA Tournament; FSU Football Rallies Past Miami
- Seminole Sunday Summary: FSU Soccer Tops Wake on OT to Advance to ACC Final
- Seminole Sunday Summary: FSU Football Crushes UMass for Third Straight Win
- Seminole Sunday Summary: FSU Soccer Stays Perfect with Pair of Wins
Tallahassee Super Regional: By the Numbers
- Updated: June 7, 2017
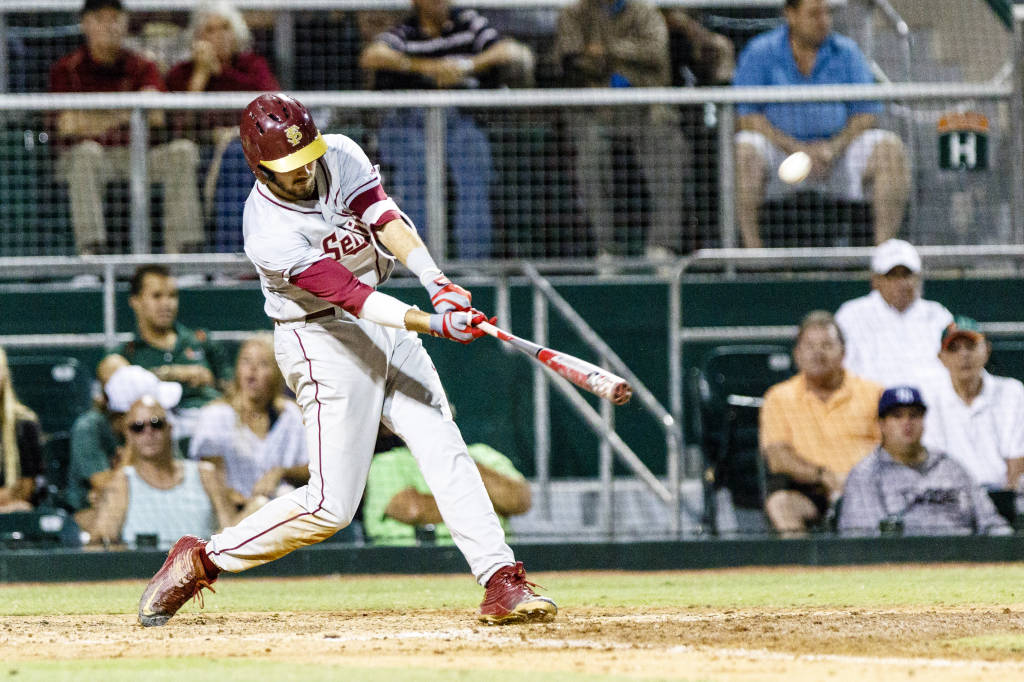 Maury Neipris/FSU athletics
Florida State and Sam Houston State each sit two wins away from the College World Series. For the Seminoles, it would be their 22nd appearance in Omaha and the first for the Bearkats.
Both teams have become accustomed to playing with their backs up against the wall. Florida State won four straight games and did so in three days to advance out of the Tallahassee Regional. Sam Houston State won consecutive 1-run games to top No. 5 national seed Texas Tech in the Lubbock Regional.
Before FSU and Sam Houston State get underway at Dick Howser Stadium on Saturday, here is how the teams stack up statistically:

Record and Schedule
By the numbers, FSU and Sam Houston State look to be evenly matched in a bunch of areas. While the teams have nearly identical records, Florida State boasts a better RPI and strength of schedule. Against teams that made the NCAA Tournament this year however, Sam Houston State is 13-7. FSU is 17-16.
Offense
Though Sam Houston State has better offensive numbers in terms of batting average and on-base plus slugging percentage, FSU has scored more by supplying more power. Robie Rojas and Andrew Fregia each have seven home runs to lead the Bearkats. FSU has five players who have at least eight homers, led by Dylan Busby. Busby’s 14 homers is as many as Sam Houston State’s top two sluggers combined.
On the average side, Sam Houston State has eight players who hit better than .280, including six who are hitting better than .300. FSU has three healthy .300 hitters, led by Busby at .317. Busby’s .608 slugging percentage is 54 points higher than Sam Houston State’s leader, Blake Chisholm. Bryce Johnson, the Bearkats’ center fielder, has a .456 on-base percentage, which is slightly higher than FSU’s leader, second baseman Matt Henderson. Henderson’s on-base percentage is .445.
Pitching
When it comes to pitching, Sam Houston State has four different starting pitchers with at least six wins while FSU has only two. The top two pitchers for both teams are Heath Donica for Sam Houston State and FSU’s Tyler Holton. Holton is 10-2, compared to Donica at 9-2. Donica’s ERA of 1.91 is better than Holton’s 2.22 mark. Holton however has more strikeouts (132-106) and a better opponents’ average (.166-.208) Donica has thrown more innings (108.1-105.1)
Out of the bullpen, Sam Houston State freshman closer Nick Mikolajchak has 13 saves with an ERA of 3.14. For FSU, Drew Carlton has headlined relievers a 2.03 ERA with six saves. When eliminating pitchers who have at least 10 starts from the equation however, Sam Houston State is 12-11 with a 3.95 ERA in 248 1/3 innings. FSU is 20-10 with a 3.46 ERA in 250 innings.
Summary
On paper, Florida State and Sam Houston State appear to be evenly matched. Although FSU played a tougher schedule, the Bearkats have actually fared better against quality competition. The offenses and pitching are also pretty even.
When you look at the production at the plate, the Bearkats tends to go station to station a little better while FSU supplies more pop. When looking at pitching depth, Sam Houston State looks to have the advantage as far as starters go, but the bullpen, believe it or not, is advantage, FSU.
Mike Ferguson is the editor of The Daily Nole. Follow Mike on Twitter @MikeWFerguson


You must be logged in to post a comment Login