
- Sunday Seminole Summary: FSU Football Adds Pair of WR Transfers
- Sunday Seminole Summary: FSU Football Exits ESD With Top-15 Class
- Sunday Seminole Summary: FSU Soccer Tops BYU for Third National Championship
- Sunday Seminole Summary: FSU Soccer Advances to National Championship Match
- Seminole Sunday Summary: FSU Soccer Heads Back to College Cup
- Seminole Sunday Summary: FSU Soccer Reaches Sweet 16; Football Tops Boston College
- Seminole Sunday Summary: FSU Soccer Wins ACC, Advances to Second Round of NCAA Tournament; FSU Football Rallies Past Miami
- Seminole Sunday Summary: FSU Soccer Tops Wake on OT to Advance to ACC Final
- Seminole Sunday Summary: FSU Football Crushes UMass for Third Straight Win
- Seminole Sunday Summary: FSU Soccer Stays Perfect with Pair of Wins
How Jameis Winston Fared Against Top NFL Defenses in 2016
- By Clint Eiland
- Updated: June 26, 2017
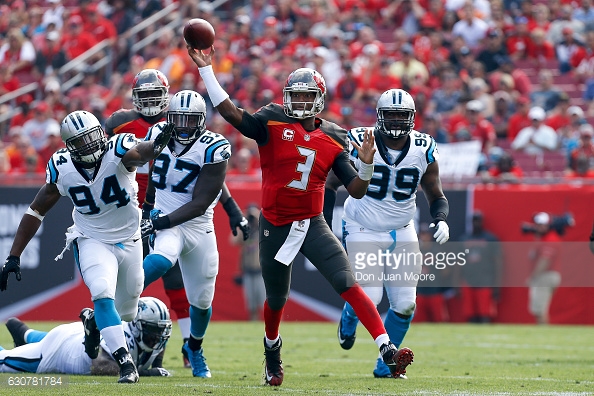 Don Juan Moore/FSU athletics
Tampa Bay Buccaneers’ (and former Florida State) quarterback Jameis Winston is off to a good start in his NFL career. After an up-and-down rookie season in 2015, Winston saw steady improvement over the course of 2016.
While his interception numbers and general gun-slinging need to be toned down some, he was instrumental in propelling the Buccaneers’ offense to a respectable mark. That is no small feat considering the little talent that was available on the team.
The Bucs addressed their offensive needs with a mix of signings and a strong draft. They picked up Desean Jackson in free agency, and then drafted O.J. Howard at tight end, Chris Godwin at wide receiver, and Jeremy McNichols at running back. Keep in mind that Winston had a good year with mostly backup-level options at receiver. Adding someone fresh off a 1,000-yard season and two high potential rookies shows a clear desire to give Winston all the weapons he needs.
His final 2016 stat-line reads: 60.8 percent completion rate, 4,090 passing yards (255.6 yards per game), 28 touchdowns, 18 interceptions, 6.8 adjusted yards per attempt. Numbers aren’t everything of course — we’ll show you more evidence of that later on — but they generally provide a decent summary. In Winston’s case, it is fairly accurate.
He was a high-risk, high-reward passer that tried to make plays all across the field. Many times, it worked out (28 touchdowns); other times, it didn’t (18 interceptions).
But how did Winston do when facing top defenses? Obviously most quarterbacks are going to see their production dip when going against elite units. The key is looking at how steep that drop-off is, and if it sheds light on any trends that might develop.
Below are two tables. One is the game logs from Winston vs. top 10 defenses and top 5 defenses. The second are the averages against each category. Teams in bold are those within the top 5. As a note: we used DVOA as the barometer for top 10/top 5 teams. The categories are average completion percentage, total touchdowns, total interceptions, yards per game, and average adjusted yards gained per pass attempt.
| Comp. % | TD | INT | Yards | AY/A | |
| Arizona Cardinals | 51.92 | 1 | 4 | 243 | 1.60 |
| Denver Broncos | 48.57 | 0 | 2 | 179 | 2.54 |
| Carolina Panthers | 60.00 | 1 | 0 | 219 | 7.97 |
| Seattle Seahawks | 75.00 | 2 | 1 | 220 | 7.68 |
| San Diego Chargers | 66.67 | 1 | 1 | 280 | 8.50 |
| Carolina Panthers | 57.14 | 1 | 1 | 202 | 5.06 |
Averages:
| Avg. Comp. % | TD | INT | YPG | AY/A | |
| Jameis Winston vs. Top 5 | 58.40 | 3 | 7 | 214 | 3.94 |
| Jameis Winston vs. Top 10 | 59.80 | 6 | 9 | 223 | 5.55 |
The teams faced by Winston were the Arizona Cardinals, Denver Broncos, Carolina Panthers (twice), Seattle Seahawks, and the San Diego Chargers. Arizona, Seattle, and Denver were the three teams who ranked in the top 5 of DVOA.
There’s a mix of good and bad here. As mentioned above, numbers don’t necessarily tell the whole story. For instance: the nine interceptions vs. top 10 defenses and seven interceptions vs. top 5 seem especially detrimental.
However, it is important to note that four of the those interceptions (in each category) came from one game — against the Arizona Cardinals in the second contest of the season. The fourth interception was an end-of-game Hail Mary while down 40-7. It was obviously not a very encouraging game from Winston, but he did substantially better as the season went on.
In fact, if one removes the Arizona game completely, Winston looks much better as a whole vs. the top 10. His averages would be a 61.47 completion rate, 220 yards per game, 5 touchdowns, 5 interceptions, and 6.35 adjusted yards per attempt.
Winston’s completion percentage over the selected games was not all too different from his season mark. That’s a good sign; it means that he’s not completely breaking down in the pocket every time he feels pressure or every time his receivers are blanketed.
The lowered touchdown-to-interception ratio has been discussed elsewhere, so there won’t be an in-depth analysis here. It should still be said that such a line would be “average” as far as most quarterback performances go. The Bucs are hoping that added talent will elevate Winston in these types of contests. He already shows some sort of consistency at the very least, which is huge for a team wondering what the next step should be.
For fun, here are a few more averages from various quarterbacks. Selected are his draft-mate Marcus Mariota, and two rookie quarterbacks in Jared Goff and Carson Wentz.
Mariota faced just one defense in the top five this past season (Denver). He did face three top 10 defenses, however (Minnesota, Houston, San Diego).
| Avg. Comp. % | TD | INT | YPG | AY/A | |
| Marcus Mariota vs. Top 10 | 49.65 | 5 | 4 | 218.5 | 5.72 |
Whereas Winston was more consistent against top defenses, Mariota had fluctuations. He averaged 61.2 percent with completions over the whole season, making his sub-50 percent average surprising. This can probably be explained by his games against Houston and Denver. He completed less than 45 percent of his passes against the former and only 30 percent against the latter.
In addition, he only tallied 88 yards against the Broncos and did not throw a touchdown in either contest. His performances against Minnesota and San Diego were much more impressive by comparison. In those games, he averaged 292 yards passing and threw for 5 touchdowns and 3 interceptions.
Jared Goff is next. Los Angeles Rams fans might want to look away.
| Avg. Comp. % | TD | INT | YPG | AY/A | |
| Jared Goff vs. Top 5 | 58.50 | 0 | 0 | 127.5 | 5.70 |
Goff only played seven games total last season. Of those seven, just two were against a top defense. Those were Seattle and Arizona, two teams in the top 5. He was apparently quite gun shy, considering he threw no touchdowns, no interceptions, and averaged less than 130 yards per game.
His completion percentage was fine, but if the offense is not moving down the field, there’s no value in it. The sad thing is the numbers might not do it justice. Both games were losses by 20-plus points and the Rams scored a combined nine points. It’s too early to call him a bust, considering he undoubtedly had the worst team around him of anyone mentioned in this piece.
Finally, Carson Wentz.
| Avg. Comp. % | TD | INT | YPG | AY/A | |
| Carson Wentz vs. Top 5 | 54.24 | 3 | 5 | 244.6 | 4.95 |
| Carson Wentz vs. Top 10 | 54.45 | 4 | 8 | 208.4 | 4.05 |
Those are more acceptable numbers for a rookie. It is interesting that he actually had a better touchdown-to-interception ratio, more yards per game, and a higher adjusted yards per attempt against top 5 defenses rather than top 10 defenses. There doesn’t seem to be a clear divide or observable trend with Philadelphia’s Wentz.
His games were against Minnesota, the New York Giants (twice), Seattle, and Baltimore. Injuries to the Eagles’ offensive line hurt his development, and his hot start was bound to end at some point. It is encouraging for Eagles’ fans to see that he still produced good yardage despite struggling in other areas.
Winston is on track to be one of the next big stars of the league. He’s fun to watch and he has clearly revitalized a Buccaneers franchise that suffered in mediocrity for the better part of the past decade. With that in mind, he’ll need to make sure that he consistently brings his A-game against better defenses. The numbers seem to point to him doing just that.
You must be logged in to post a comment Login